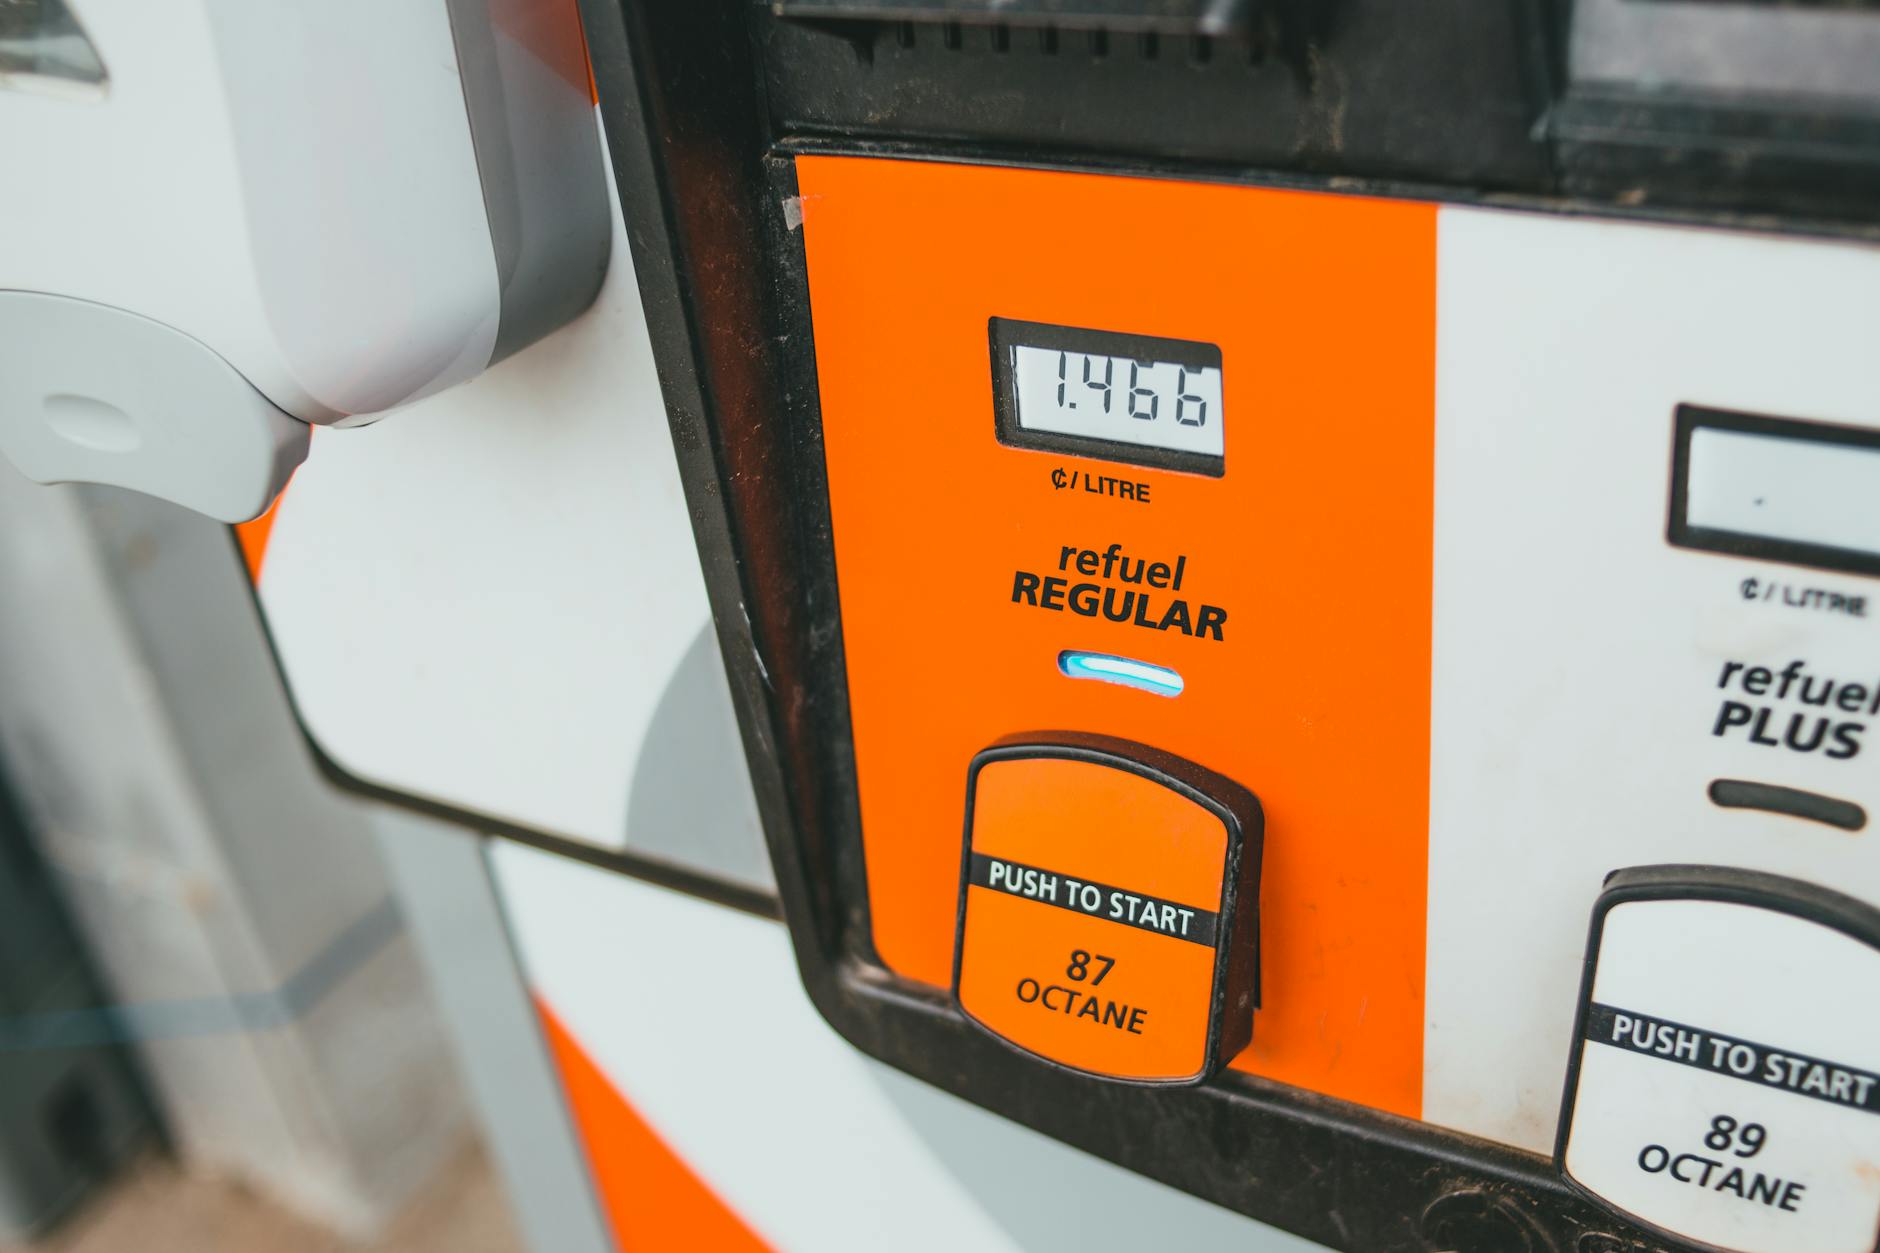
As of May 2026, gas prices in America have reached their highest levels in years, with the national average hitting $4.53 per gallon on May 14. The most expensive cities for drivers are concentrated on the West Coast, with Sacramento, California leading the nation at $6.16 per gallon—nearly $1.63 more than the national average. Meanwhile, drivers in Oklahoma enjoy the cheapest prices at $3.94 per gallon, highlighting the dramatic regional disparities that have emerged as supply chain disruptions ripple through the energy markets.
These price levels represent a staggering increase from just one year ago. On May 12, 2025, the national average was $3.14 per gallon, meaning prices have jumped 43.6% in just twelve months. Since the start of 2026, gas prices have climbed 60%, and the acceleration became particularly sharp in late February following the closure of the Strait of Hormuz and tanker blockade in the Persian Gulf, which suspended oil and fuel supply from the region.
Table of Contents
- Where Are Gas Prices Highest in 2026?
- The Real Cost of High Gas Prices on Driver Budgets
- What Caused the Rapid Price Spike Since February 2026?
- Year-to-Date Price Growth and Historical Context
- Regional Variations and Why They Matter
- Industry Impact and Economic Consequences
- What to Expect Going Forward
- Conclusion
- Frequently Asked Questions
Where Are Gas Prices Highest in 2026?
California dominates the nation’s most expensive gas prices, with the state average sitting at $6.15 per gallon as of mid-May 2026. Sacramento, the state capital, actually exceeds this average at $6.16 per gallon, making it the single most expensive city for drivers in America. This means a driver filling up a 15-gallon tank in Sacramento would pay approximately $92.40—more than $24 more than a driver in Oklahoma filling the same tank.
Washington State ranks second nationally at $5.77 per gallon, while Hawaii comes in third at $5.64 per gallon. The West Coast concentration reflects regional factors including state-specific fuel regulations, refinery capacity constraints, and limited pipeline infrastructure. In contrast, the southern United States has experienced far lower prices, with Louisiana at $4.00 per gallon, Mississippi at $3.98 per gallon, and Oklahoma at the national low of $3.94 per gallon. The $2.22 per gallon difference between Sacramento and Oklahoma represents a 56% premium for California drivers—a burden that compounds monthly for commuters and businesses relying on fuel.
The Real Cost of High Gas Prices on Driver Budgets
For drivers in major metropolitan areas, the financial impact extends well beyond the pump. In high-traffic regions including the Bay Area, Los Angeles, Dallas-Fort Worth, and Washington D.C., commuters are now spending nearly $100 more per month on gas compared to a year ago. For a driver commuting 50 miles daily in the Sacramento area, this translates to roughly $1,200 in additional annual fuel expenses—money that would otherwise go toward groceries, rent, or savings.
The burden falls unevenly across the country. A commuter in Oklahoma who drives the same distance would spend approximately $788 per year on gas at current prices, compared to $1,988 in Sacramento. This disparity is not merely a regional inconvenience; it represents a substantial tax on the cost of living in high-price states, particularly for lower-income workers and delivery drivers who have no choice but to absorb these costs. Many delivery services, rideshare companies, and small businesses have already announced price increases for consumers, effectively passing along the fuel surcharge.
What Caused the Rapid Price Spike Since February 2026?
The primary catalyst for the current price surge dates to February 28, 2026, when the closure of the Strait of Hormuz and a tanker blockade in the Persian Gulf suspended oil and fuel supply from the region. This geopolitical disruption triggered a sharp acceleration in prices, with gas climbing approximately 53% from $2.96 per gallon on February 26 to the current $4.53 level. Gasoline futures have traded above $3.60 per gallon, approaching the four-year high of $3.75 reached on May 4, 2026.
The Persian Gulf supplies roughly 20-25% of global oil production, making any disruption to shipping through the Strait of Hormuz consequential for markets worldwide. In the United States, the supply shock compounds an already-tight market that was already experiencing price increases throughout 2026. The closure has forced refineries to adapt to lower crude oil availability and pay premium prices for alternative supply sources. Energy markets expect prices to remain elevated as long as the blockade persists, with potential for further increases if the situation escalates or extends beyond current expectations.

Year-to-Date Price Growth and Historical Context
The 60% increase in gas prices since January 1, 2026 represents one of the steepest year-to-date climbs in recent memory. To put this in perspective, this growth rate outpaces inflation across most other consumer goods and services. A family that allocated $200 per month to gas in January would now need approximately $320—an additional $120 monthly expense that was not budgeted at the start of the year. Comparing this increase to the year-over-year figure reveals the acceleration.
The 43.6% jump from May 2025 to May 2026 is substantial, but it masks the reality that most of this increase occurred after February 2026. If prices had remained at early-2026 levels, drivers would be looking at roughly 10-15% year-over-year increases rather than 43.6%. This distinction matters for understanding what caused the spike and projecting future trajectories. The question now is whether the supply disruption will be resolved quickly or whether it will persist, fundamentally altering energy economics for the remainder of 2026.
Regional Variations and Why They Matter
The $2.22 difference between the highest (Sacramento at $6.16) and lowest (Oklahoma at $3.94) state averages reveals important supply and regulatory differences. California’s stricter fuel regulations require refineries to produce specific blends that cannot easily be imported from other states. This creates a captive market where California refineries have more pricing power. Additionally, California’s distance from major crude oil pipelines and refineries means more transportation costs are built into the final price.
Hawaii’s high prices, similarly, reflect the costs of shipping fuel across the Pacific Ocean. However, a critical limitation in comparing prices is that regional averages mask significant variations even within states. A driver in rural Northern California or Oklahoma might have even fewer options and less ability to shop for better prices than someone in Sacramento or Oklahoma City. During supply disruptions or price spikes, these factors become even more pronounced, and drivers in more remote areas may face localized shortages or additional markups. The data available focuses on state and city averages, which means it may not capture the true range of prices experienced by all drivers.

Industry Impact and Economic Consequences
Beyond individual drivers, high gas prices cascade through the economy. Transportation companies, delivery services, and logistics networks face immediate pressure on margins. Airlines, which hedge fuel costs, face exposure to sustained high prices if the Strait of Hormuz remains closed.
📨 Get Free Accountability Coverage Alerts
Free · No spam · Unsubscribe anytime
Grocery stores, restaurants, and retailers must decide whether to absorb increased delivery costs or pass them along to consumers through higher menu and shelf prices. The May 2026 price environment is creating measurable impacts on consumer spending in other categories. Analysis from Federal Reserve economic data and purchasing patterns suggests consumers in high-gas-price regions are reducing discretionary spending, particularly on travel and entertainment. This creates a potential economic headwind as summer vacation season approaches, with families deciding to postpone or cancel trips due to transportation costs.
What to Expect Going Forward
The trajectory of gas prices in 2026 will depend almost entirely on developments in the Persian Gulf and the Strait of Hormuz. If the blockade resolves within weeks, prices could decline toward $3.50-$3.75 per gallon by mid-summer. If the closure extends through summer, prices could remain near current levels or potentially climb further as summer driving season increases demand.
Futures markets are pricing in continued disruption, with crude oil traders expecting elevated prices through at least June 2026. Looking further ahead, the volatility of gas prices in 2026 underscores a structural vulnerability in global energy markets. Even with increased domestic drilling and renewable energy deployment, the United States remains partially dependent on global crude oil markets and strategic chokepoints like the Strait of Hormuz. For drivers planning fuel budgets, the prudent approach is to assume prices will remain elevated for several more weeks and adjust travel plans and household budgets accordingly.
Conclusion
Gas prices in May 2026 have reached levels not seen in years, with the national average at $4.53 per gallon and drivers in Sacramento facing $6.16 per gallon at the pump. The 43.6% year-over-year increase and 60% year-to-date jump reflect both baseline 2026 price trends and a sharp acceleration triggered by the February 2026 closure of the Strait of Hormuz. Drivers in high-price regions like California and Washington are spending nearly $100 more per month on fuel compared to a year ago, while those in Oklahoma enjoy significantly lower costs at $3.94 per gallon.
The disparity between the most and least expensive states highlights how regional factors—fuel regulations, refinery capacity, transportation costs, and pipeline access—create a fragmented energy market in the United States. Consumers, businesses, and policymakers should monitor developments in the Persian Gulf closely, as any resolution of the supply disruption could bring meaningful price relief. In the interim, drivers should budget for continued elevated prices and consider adjustments to travel and consumption patterns.
Frequently Asked Questions
What is the current national average gas price as of May 2026?
The national average is $4.53 per gallon as of May 14, 2026, according to AAA Fuel Prices.
Which state has the most expensive gas?
California has the highest state average at $6.15 per gallon, with Sacramento specifically at $6.16 per gallon—the highest price for any specific city.
What caused the spike in gas prices since February 2026?
The closure of the Strait of Hormuz and a tanker blockade in the Persian Gulf on February 28, 2026 suspended oil and fuel supply from the region, triggering a 53% price increase from $2.96 to $4.53 per gallon.
How much more are drivers paying compared to last year?
Prices have jumped 43.6% from May 2025 ($3.14/gallon) to May 2026 ($4.53/gallon). Drivers in high-traffic regions are spending nearly $100 more per month.
Which states have the cheapest gas?
Oklahoma has the lowest prices at $3.94 per gallon, followed by Mississippi at $3.98 per gallon and Louisiana at $4.00 per gallon.
When might prices come down?
Prices depend on resolution of the Strait of Hormuz closure. Industry analysts expect prices to remain elevated through June 2026, with potential relief if the blockade is resolved within weeks.
You Might Also Like
- Gas Prices Today: Why Drivers Are Seeing Different Prices by ZIP Code
- Gas Prices Today: What Drivers Are Paying in Every Major State
- Gas Prices Today: Phoenix Drivers Brace for Higher Summer Costs