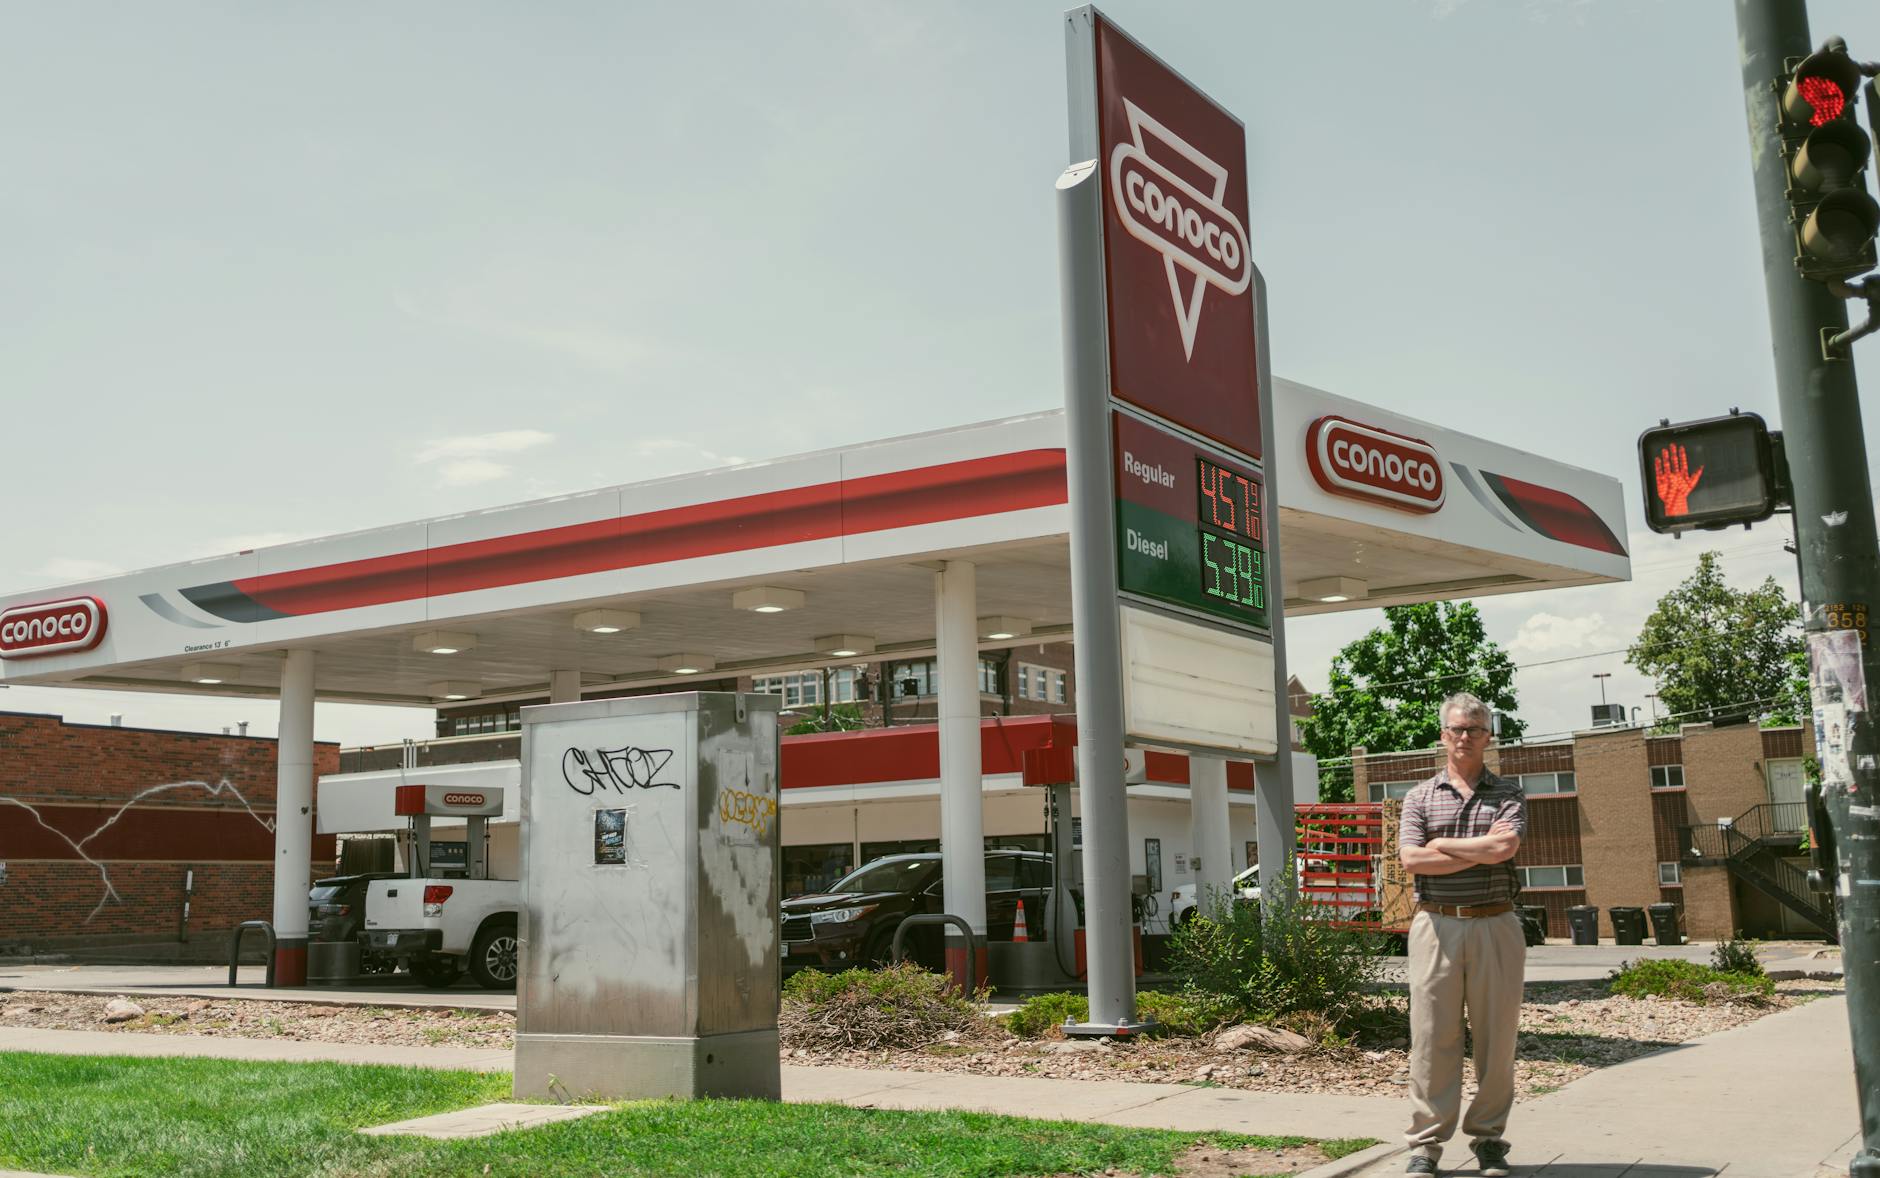
Yes, Americans could see $6 gas again, and for many, it’s not a theoretical possibility—it’s already happening. California motorists are currently paying $6.15 to $6.16 per gallon as of mid-May 2026, according to AAA fuel price data. For the rest of the nation, $6 gas isn’t imminent, but it’s within reach. The national average sits at $4.50 to $4.53 per gallon, and industry analysts warn that prices could climb to $5 by Memorial Day and potentially breach $6 later this summer if geopolitical disruptions continue.
This represents a dramatic reversal from just a year ago, when Americans paid around $3.14 per gallon. The spike isn’t a gradual creep—it’s a sharp acceleration. Gas prices have surged 43.6 percent year-over-year and a stunning 60 percent since the start of 2026. Every state in the nation is experiencing double-digit percentage increases, making this a national phenomenon with real consequences for household budgets, business transportation costs, and the broader economy. The primary culprit is a disruption to global oil flows through the Strait of Hormuz, one of the world’s most critical shipping chokepoints, which has halted movement of roughly 20 million barrels per day of crude oil and refined products since early March 2026.
Table of Contents
- How High Can Gas Prices Go This Summer?
- Understanding the Strait of Hormuz Disruption
- Regional Price Variations and What They Reveal
- What’s Driving the Year-to-Date 60 Percent Spike
- The Risk of Demand Destruction and Economic Impact
- Summer Driving Season and Memorial Day Weekend
- What Happens If the Strait of Hormuz Disruption Continues
- Conclusion
How High Can Gas Prices Go This Summer?
The forecasting consensus points to significant further increases through the summer months. Patrick De Haan, a prominent fuel price analyst, projects that gas prices could reach $5 per gallon nationally by Memorial Day weekend and potentially climb to $6 or higher later in the summer if the Strait of Hormuz remains disrupted. This isn’t speculation based on models alone—it’s grounded in real-time supply constraints and historical price behavior during geopolitical crises. The $6 threshold would match or exceed prices seen during the 2008 energy crisis, when crude oil temporarily spiked above $140 per barrel before the financial meltdown collapsed demand.
Geography matters enormously in these projections. California has already crossed the $6 threshold and will likely see prices push toward $7 or higher given the state’s unique fuel formulation requirements and limited refinery capacity. Washington state is at $5.77, and Hawaii sits at $5.64—both vulnerable to further increases. Meanwhile, states like Oklahoma ($3.94), Mississippi ($3.98), and Louisiana ($4.00) have benefited from proximity to oil production and refining infrastructure, but they’re not immune. Even with lower absolute prices, these states have still experienced 40-plus percent year-over-year increases, affecting working families who depend on driving for employment.

Understanding the Strait of Hormuz Disruption
The Strait of Hormuz, the narrow waterway between Iran and Oman, is the global economy’s oil lifeline. Roughly 20 percent of the world’s crude oil and refined petroleum products pass through this 21-mile chokepoint daily. When shipping activity halted in early March 2026, it created an immediate and ongoing supply shortage that no amount of domestic U.S. production can fully compensate for. The disruption has persisted for over two months, and there’s no clear resolution timeline, which is why analysts are increasingly bullish on higher prices through the summer.
This is a critical limitation to understand: the United States, while a significant oil producer, is not energy-independent for refined products. The nation imports substantial quantities of gasoline and diesel, particularly specialized fuels like California’s unique blends required for environmental compliance. The Strait disruption doesn’t just affect crude oil availability—it affects the finished products Americans pump into their vehicles. Refineries, even those running at full capacity, cannot instantly substitute domestic production for interrupted imports. The lag between supply disruption and price response is typically weeks to months, which means the full impact of the March disruption may still be working through the system in May and June.
Regional Price Variations and What They Reveal
The spread between the cheapest and most expensive gas in America tells a revealing story about infrastructure and regulation. Oklahomans pay $3.94 per gallon while Californians pay $6.16—a difference of $2.22 per gallon, or roughly 56 percent more. For someone filling up a 15-gallon tank weekly, that’s an additional $163 per month just for geography. Washington state ($5.77) and Hawaii ($5.64) round out the top tier, while Texas ($4.27) and Florida ($4.29) represent middle-ground pricing for more populous regions. These variations exist because of distinct regulatory requirements and refinery configurations.
California mandates special fuel blends to reduce smog and meet air quality standards, which requires more expensive refining. The state has also seen several refineries close or significantly reduce output in recent years, tightening the supply. Hawaii’s isolation makes it dependent on imports for refined products, with limited refining capacity. Meanwhile, states with robust refinery networks and less stringent environmental mandates benefit from more competitive pricing. The warning here is important: federal policy changes that further restrict refining capacity, extend environmental mandates, or reduce import flexibility could push even states with lower current prices closer to the $6 mark.

What’s Driving the Year-to-Date 60 Percent Spike
The magnitude of the year-to-date increase—60 percent from January to May 2026—deserves careful attention because it reveals the unusual severity of current supply constraints. In typical years, crude oil prices might fluctuate 15 to 20 percent between the beginning and middle of the calendar year. A 60 percent increase in five months suggests that current disruptions are more acute than seasonal variations can explain. The comparison to historical periods is instructive: the 2008 oil spike took several months to develop and was driven by a combination of geopolitical tension and speculative financial trading.
The current spike compressed that timeline into weeks. The year-over-year comparison is equally striking: $3.14 per gallon in May 2025 to $4.50 in May 2026 represents a 43.6 percent increase in just 12 months. For the average American household spending roughly $200 to $300 monthly on gasoline (depending on commute distance and vehicle efficiency), that translates to an additional $85 to $130 per month in fuel costs. Over a year, that’s $1,000 to $1,560 in increased transportation expenses—money that comes directly out of household discretionary spending, affecting everything from dining out to home maintenance to emergency savings.
📨 Get Free Accountability Coverage Alerts
Free · No spam · Unsubscribe anytime
The Risk of Demand Destruction and Economic Impact
One critical limitation of the current $6 forecast is whether demand can sustain at such prices without collapsing. During the 2008 crisis, prices above $4 per gallon triggered significant behavioral changes: longer commutes suddenly became unaffordable, suburban home values began declining, hybrid and efficient vehicle sales surged, and people consolidated trips or turned to public transportation. If gas reaches $6 nationally, similar demand destruction becomes inevitable. This isn’t necessarily a warning about imminent economic collapse—it’s recognition that $6 gas creates powerful incentives for people to adjust consumption patterns. The economic warning is real but not uniformly distributed.
A Manhattan resident or someone in a dense urban area relies less on personal vehicle consumption and may absorb $6 gas with minimal lifestyle change. A nurse commuting 45 minutes each way from a suburban home faces a fundamentally different calculus. Rural Americans dependent on vehicles for agricultural work, medical appointments, and basic commerce face genuine hardship. Businesses with delivery fleets, from package services to restaurant delivery operations, face margin compression at these price levels. The risk is not that the economy breaks, but that $6 gas accelerates existing regional economic divides and places strain on cost-sensitive sectors.

Summer Driving Season and Memorial Day Weekend
Memorial Day weekend, traditionally the unofficial start of American summer driving season, serves as a critical price benchmark. GasBuddy’s projection of $5 per gallon by that date would hit millions of Americans planning road trips, family reunions, and vacation travel. Unlike winter months when driving demand softens, summer sees consistent high utilization as schools close, vacation schedules align, and recreational travel peaks.
A price spike right at the beginning of this period would have maximum impact on summer vacation budgets and consumer sentiment. Consider the practical impact: a family driving 12 hours each way (roughly 1,200 miles round trip) in a vehicle averaging 25 miles per gallon would use 48 gallons at $5 per gallon, totaling $240 in fuel costs alone. At $6 per gallon, that same trip costs $288—a 20 percent increase that might tip a borderline vacation decision from “go” to “cancel” or “reduce scale.” Across millions of households, this decision-making margin affects summer tourism revenue, theme park attendance, family reunions, and the hospitality industry that depends on summer travel.
What Happens If the Strait of Hormuz Disruption Continues
The single biggest variable in the $6 gas forecast is whether the Strait of Hormuz remains disrupted through summer. If shipping resumes within the next month or two, prices will begin moderating as supply catches up to demand. If the disruption persists—a scenario that’s not implausible given geopolitical tensions—then $6 gas becomes increasingly likely not just as a peak but as a sustained price level. Industry analysts are preparing contingency plans for both scenarios, but the uncertainty itself contributes to elevated prices because refineries and traders are pricing in supply risk.
The forward-looking question is whether Americans and policymakers will treat this as a temporary crisis or catalyst for structural change. Higher fuel costs incentivize investments in public transportation, electric vehicle adoption, and energy efficiency. However, short-term pain rarely drives long-term policy change, and most responses will likely focus on temporary relief measures—fuel tax holidays, strategic petroleum reserve releases, or subsidies—rather than fundamental supply-side solutions. What happens between now and Labor Day will likely define not just summer gas prices but also voter sentiment heading into the fall political season.
Conclusion
Americans could indeed see $6 gas again this summer, and for Californians, it’s not a hypothetical—they’re already living it. The national average of $4.50 to $4.53 per gallon in May 2026 represents a historic spike: 43.6 percent year-over-year and 60 percent year-to-date. The Strait of Hormuz disruption that began in early March continues to constrain global oil supplies, and without resolution, industry analysts project prices could breach $6 by mid-summer. This isn’t speculation but rather a reasonable extrapolation of current supply constraints and historical precedent.
The practical implication is clear: American households should prepare for higher fuel costs through the summer months and adjust transportation budgets accordingly. For those planning summer travel, filling up sooner rather than later offers modest savings if prices continue climbing. For businesses dependent on fuel, the current environment requires serious cost analysis and potentially difficult operational decisions. The broader economic impact depends heavily on whether the Strait disruption resolves quickly or persists, a variable entirely outside American control but increasingly central to household finances and national economic outlook.
You Might Also Like
- Gas Prices Today: Could Crude Oil Reach $120 Again?
- Gas Prices Today: Why Americans Are Talking About Gas Again
- Gas Prices Today: National Average Could Rise Again This Month